
Snake Draft Strategy: 3 Year Review
- Alex Cates
- Aug 13, 2022
- 6 min read
Updated: Sep 4, 2022
This will be part 1 of my 3-year review series. Each Saturday between now and the NFL season I will be releasing a new section.
Week 1: Snake Draft Strategy
Week 4: Are you smarter than ESPN: Lineup Decisions
As we approach the 2022 fantasy season, I wanted to take a look back at the data I have collected covering the last 3 fantasy seasons to better understand what general strategies work in a snake draft. If you want to see the results for a specific year, check out my posts on the 2020 and 2021 seasons. If you are looking for auction draft results, you can check out this post from the 2020 season or stay tuned for the upcoming posts.
The Data
All data included here are taken from ESPN leagues. Over the years I have become more stringent in my requirements for these leagues and as such, the total number of leagues I am analyzing here is ~1500 leagues providing ~17,000 teams. Most of these are random public leagues and to control for quality, I have removed any team that failed to set a complete starting lineup more than 3 weeks over the season. This allows owners to check out if they don't make the playoffs while ensuring that they actually tried throughout the season. New this time around is the addition of teams that have signed up for FantasyLeagueReport.com. This is a league analyzer I am developing and I figure any manager interested in signing up is going to be in a competitive league. Finally, to prevent too much variation from league settings, I excluded any league with extreme scoring numbers and limited the size of the league to between 8 and 12 teams.
If we split it across years, we have ~500 leagues in 2019, ~300 leagues in 2020, and ~750 leagues in 2021 that meet our criteria. For all the analyses below, I first calculated the results for each year and then averaged the 3 years together to create the aggregate score. This ensures each year has equal weighting despite the variation in the amount of underlying data.
With that out of the way, let's dive in.
Pick Slot
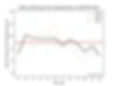
Line plots of the odds of winning your championship based on your pick slot. Light colored lines represent individual years while the black line represents the average across all three years. The red horizontal line represents your base odds of winning the championship.
A couple of interesting aspects right off the bat. First, while the last 2 years have largely favored the early middle picks (say 4-7) 2019 really favored picks 2-4. As such we see a general advantage to picks 2-6 across the last 3 years. The curse of the first pick seems to be real, though we will see if that continues with Jonathan Taylor this year who seems to be the safest no 1 pick in recent memory. That said, if you can choose your slot this year, there is certainly a historical precedent for choosing between 2 and 6 rather than first overall.
When To Draft A QB
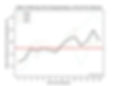
Line plots of championship odds based on when the team drafted their first QB. Light colored lines represent individual years while the black line represents the average across all three years. The red horizontal line represents your base odds of winning the championship.
While this graph has a "no duh" quality, it is still interesting to see. First, the takeaway. You should wait on drafting a QB. Yes, in the last 2 years you could have taken a QB early and improved your odds of a championship, the real value in all three years seems to be later (basically taking a QB in the 8th round or later). I'll admit that I had been considering more of a Hero QB strategy and even drafted Mahomes in one of my leagues last year, but I doubt I will be doing so again. Late QB all the way.
When To Draft A TE

Line plots of the odds of winning the championship based on when a tight end was drafted. Light colored lines represent individual years while the black line represents the average across all three years. The red horizontal line represents your base odds of winning the championship.
Again, the data seems to match conventional wisdom when it comes to Tight Ends. For instance, you either want to take a TE from the first tier (think Kelce, Andrews, Waller, Kittle) or wait till the very end to draft one. While the benefit to following this strategy is only ~a 1% increase, the cost is a 2-3% decrease in your championship odds. Again, this tends to be the conventional advice, but it is nice to see it bear out in the data.
Positions To Target In The First 2 Rounds

Bar plots of the average odds of winning a championship based on the first 2 positions taken. Scatter plot represents individual year odds and the red line represents the base odds of winning a championship.
Wow, now this graph is not what I expected. The first thing to note is the greatness of Travis Kelce. He was the common tight end being taken in the second round which drove 2 of the top 3 positional pairings. The third involved taking a tight end in the first round, which is only based on this past year with Travis Kelce again. Basically, if you had Travis Kelce the last 3 years you probably did alright, we'll see if he can maintain that dominance this year.
The second surprise to me is that the 4 most common pairings (WR/RB, RB/RB, RB/WR, and WR/WR) are right in a row, and only WR/RB had a positive return. That is largely driven by the outside benefit from this past year (where players who started WR/RB won a staggering 16% of their leagues). together the data shows that the average strategies will give you safe but normal returns.
Overall, the takeaway for me is you can't go wrong taking the classic positions (RBs and WRs) or taking Travis Kelce, though there is an advantage to avoiding WR/WR, a point that is supported in the zero RB section below.
Number of RBs and WRs to draft

Line plots of your odds of winning a championship based on the number of Running Backs (left) and Wide Receivers (right). Light colored lines represent individual years while the black line represents the average across all three years. The red horizontal line represents your base odds of winning the championship.
When we look at the number of RBs and WRs to draft in total, the takeaway is simple. Just keep drafting them! The odds of winning the championship basically linearly increases with the number of RBs and WRs drafted. Practically, this means that you should not draft a backup TE or QB or K or DEF. Just keep hammering the RB and WR positions.
Zero RB

Bar plot of your championship odds with a Normal or a Zero RB strategy. Scatter plots represent the odds for a given year while the red line represents the baseline championship odds.
As a reminder, I define zero RB as not having drafted a running back in the first 4 rounds. Once again, we see that zero RB is just not an advantage. Now the caveat as always is that the zero RB strategy relies on active management. But I really can't justify it if the average team sees their odds of winning the championship cut in half!
ADP Value

Line plot of your championship odds relative to the ADP value accumulated over the first 6 picks. Light colored lines represent individual years while the black line represents the average across all three years. The red horizontal line represents your base odds of winning the championship.
ADP value is defined by where a player was drafted vs the player's ADP. So taking a player with ADP of 15 at pick 20 would give you 5 ADP value.
Unsurprisingly, there is value in accumulating ADP value at the beginning of the draft. That said, there are actually plus odds with as low as -20 accumulated value. So while yes you should try to take advantage of any ADP value that may fall your way, I wouldn't get too caught up in searching for ADP value. Get the guys you like and as long as you don't make any crazy reaches, you should be ok.
Limitations
The biggest limitation is that I am not controlling for managerial skills and controlling for the most basic league settings. Non-standard draft strategies are more likely to succeed when the manager is skilled or playing in a league with unusual scoring settings. So make sure to take all of these findings as general guidelines and adjust them to your league. If you are curious about how to do that, check out the league settings comparison app I built.
Conclusion
Let's round up the takeaway points
Try to pick in the first half of the draft
Wait to draft a QB
Take a TE early or late, not in the middle
Spend your first 2 picks on RBs and/or WRs or Travis Kelce
And then keep drafting RBs and WRs, you can never have too many
Don't go zero RB
Try to accumulate ADP Value, but it's still ok to reach a little to get your guy
Each of these strategies seems to increase your odds of a championship by 1-2% if followed. Combined I think it's reasonable they may increase your odds of a championship to 15+% (a ~50% increase from baseline odds) assuming the trends of the last 3 years hold. I know I will be following these strategies in my leagues and we will see how I do. Happy Drafting All!
Questions? Comments? Let me know at ac@alexcates.com. Want to read more breakdowns like this? sign up for my newsletter. Finally, like what I do? Consider supporting me on buy me a coffee or by signing up for fantasyleaguereport.com