Catan Breakdown: Starting Settlement Numbers Decision
- Alex Cates
- Dec 3, 2022
- 7 min read
Updated: Dec 6, 2022
Note: Thanks to William Lima and Long T for their help and thoughts on developing this analysis.
Where to place your starting settlements?
Those who have played Settlers of Catan have agonized over this decision. Do you grab the better numbers? Double up on the same numbers or diversify? Do you want 6 hexes or should you take 5 while claiming a valuable port from the get-go?
These questions race through every player's head as they try to decide where to place their first settlements. Today, we will try to answer at least some of them, specifically the numbers. Double up or diversify? 5 or 6? Using a combination of collected game data and simulation let's try to figure it out.
Simulation Methodology
The focus of this post will be a simulation of 100,000 games. For each game, we will roll the dice 70 times (based on the average length of a game I've previously reported) and we will record the number of resources every possible starting combination would have earned. This includes the truly awful (Only having a 2 for instance) and the absurdly good (say each settlement is on a 6,8,5 for instance).
By simulating these across 100,000 games we can examine how often a set of numbers collects a good amount of resources. For this post, I will report 3 levels. First, how often a set of numbers produces enough resources to win the game >50% of the time. Second, how often does a set of numbers produce enough resources to increase your chances of winning (>25% for a 4-person game for instance)? And third, how often a set of numbers fails you, which I am defining as giving you less than a 12.5% chance of winning (effectively cutting your odds in half or worse).
So the first thing we need to do is figure out how many resources matter.
Odds of Winning with X resources
Using the data from 312 games of Catan, we can determine how different resource totals predict winning the game. First, we will normalize all player's resource totals to a 70-turn game (Simply by dividing their total resources by the total number of turns to get the number of resources per turn and multiplying by 70). For each resource total, we can then plot the percent of games where the winning player had that resource total and create a linear fit. To help with generalizability, I will also z-score these numbers (subtract the mean and divide by the sample's standard deviations). As we will see, this will make the definition of my 3 levels surprisingly nice later on.

Scatterplot of the normalized number of resources gained throughout the game and the odds of winning. Includes a linear regression of the line of best fit and horizontal lines denoting our 3 thresholds (12.5% odds of winning or less, greater than 25% chance, and greater than 50% chance).
When we look at the resource totals, we see that roughly 40 resources (z score of -1) is at the 12.5% win odds, 65 ish (z score of 0 or the mean) gives us a 25% chance, and 120ish resources (z score of 2) gives us a 50% chance of winning. So we will use those levels in our simulations as defined in the table below:
Category | Odds of Winning | Resource total (per 70 turns) | Z Score of Resource total (per 70 turns) |
Significantly Fewer Resources | Less than 12.5% | 40 | -1 |
Above Average Resources | Greater than 25% | 65 | 0 |
Significantly More Resources | Greater than 50% | 120 | 2 |
Note: Two flaws here that I want to address now. First, these resource totals are across the entire game not just what is produced by the 2 starting settlements. Second, your resources per turn generally increase as the game progresses (due to additional settlements and cities being built). Therefore, when I am normalizing, it may be biasing longer games (those that took more than 70 turns) vs shorter games. However, since all players involved get these adjustments, at least some of this bias is canceled out. I am not claiming it is perfect, but it should be good enough for our purposes.
With those thresholds established, let's look at our simulation results.
To Diversify or Not
Should you look to get 6 different numbers? or should you try to double up some numbers? If the numbers hit, there could be huge rewards, but there is also greater risk. Let's take a look at the simulation results.
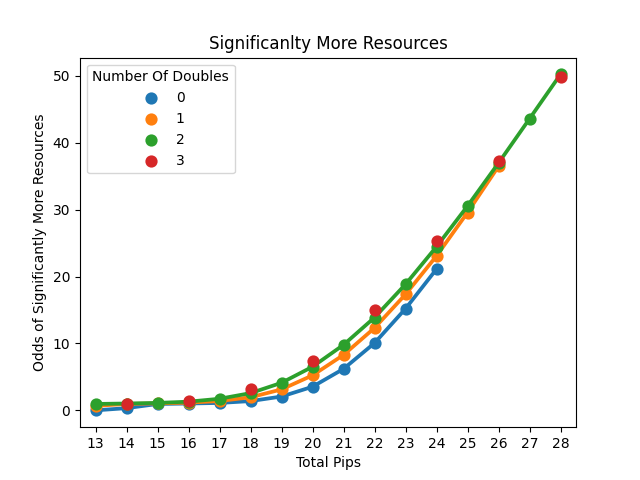
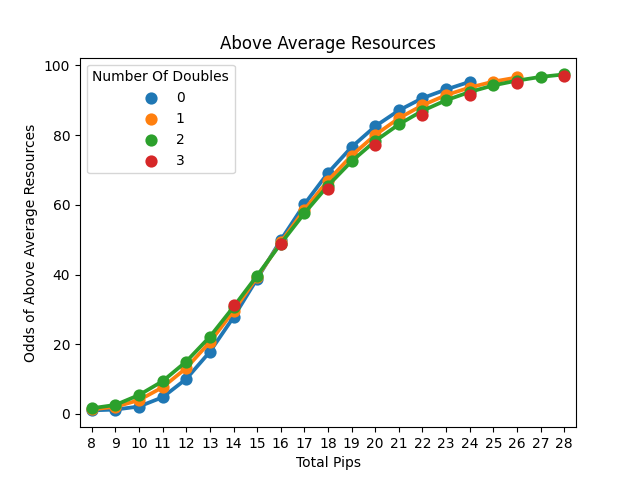
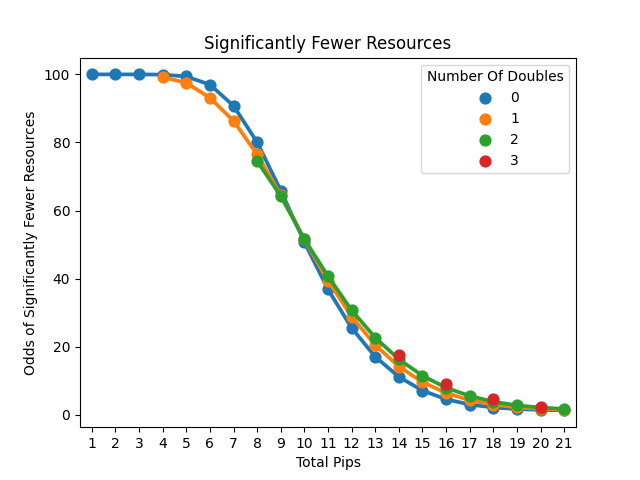
Line plots of the odds of receiving significantly more (first graph), more than average (second graph), or significantly less (third graph) resources.
First, The graphs above and all the simulation result graphs will be plotted vs total pips. For those that don't know, the pips mark the expected number of times a number should be rolled in 36 rolls, so the number 6 has 5 pips as it is expected to be rolled 5 times in 36 rolls. By graphing against total pips, we are able to control for how good the numbers are and focus on the variable we care about (in the graphs above this is the number of doubles). It also provides a way of comparing how much of an effect it has. If we look horizontally we can get a sense of how many pips we are willing to give up for a double number for instance. Now let's look at the data.
We see exactly what we expected when it comes to doubling up. Doubling is a riskier strategy with higher rewards. We see that doubling consistently increases your odds of significantly more resources, enough that a double is worth about a full pip (with 2 doubles being worth 2 pips).
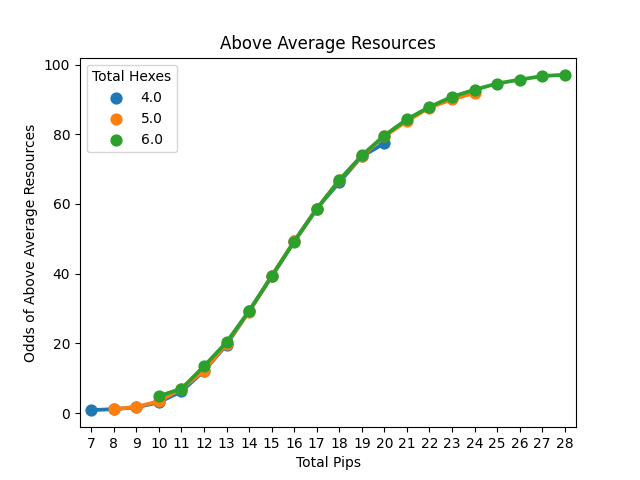
When we scroll to look at the odds of gaining above-average resources we see an interesting effect. If your numbers are bad, you should go for more doubles as having a double gains you about 1 pip in value for bad numbers. However, at around 16 total pips the relationship flips. Now diversification is good, with a double costing you about 1 pip in value when you have good numbers.
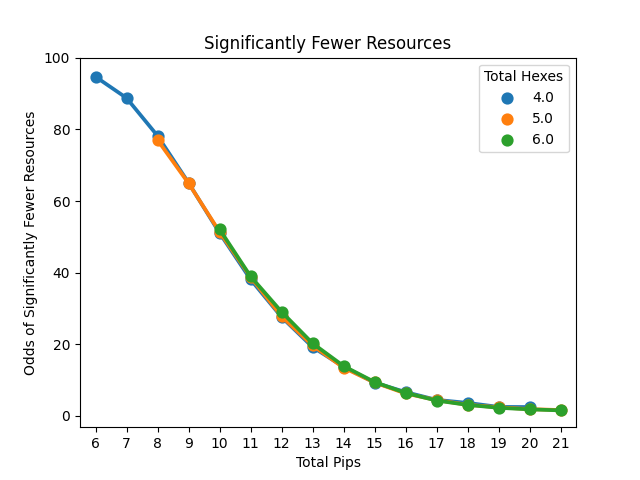
Finally, when we look at the odds of significantly fewer resources, we can see that doubles again are riskier. Now grabbing a double probably costs you about 3/4 of a pip in value, increasing your chances of significantly fewer resources.
It should be mentioned that all these relationships vary based on how many pips are involved with the differences largely disappearing in the extremes. To put it in perspective, I expect most starting settlements to grab 18-21 pips on average. When we zero in on that range we can see that the risk of significantly fewer resources is minimized.

Zoomed in graphs of how doubling up on resource numbers affects your odds of more, above average, or fewer resources, focusing on realistic pip totals.
Here we can see that adding a double adds about a 1% chance of significantly greater resources and costs only a 0.5% chance of significantly fewer. The real problem is it also costs a 2-4% chance of above-average resources. While you will still on average succeed in these scenarios, it helps to put what going for doubles means. My takeaway is I think it is worth it to try to double up on a number. I wouldn't give up more than 2 pips to do so, but I would probably give up 1 pip and accept that I am also increasing my chances of the game going the wrong way.
When should you choose 5 hexes over 6?
The other question is how much does not placing both settlements on 3 hexes hurt you? While you sometimes don't have a choice with your second settlement, there will be times when you are choosing between 3 hexes, but with bad numbers or 2 hexes with better numbers or with a port. How are you supposed to decide?
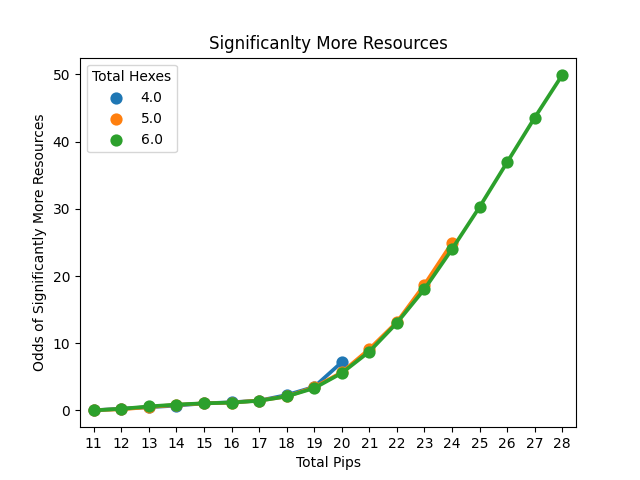
Line plot of the odds of significantly more (first graph), above average (second graph), or significantly fewer (third graph) based on the number of hexes settled upon.
This is both surprising and not. Essentially, there is no difference in the number of resources gained so long as your account for pips for any of the 3 outcomes. This makes sense as this is a simulation of the total resources gained, so the total pips should relate to the number of resources regardless of how you reach that total. So 19 pips from 4 hexes are as good as 5 hexes which are as good as 6. The only variation we see is an effect of the doubles (as the higher totals from fewer hexes require doubling up on good numbers). To me, this means that you shouldn't worry about the numbers on the hexes if the pips are even when deciding between a 2 and 3-hex spot. Instead, it is what resources you get and the value of the port that should be considered.
Just to drive the point home, here are the zoomed-in graphs of all 3.

This is basically saying the same thing as before. I'd say when we zoom in we see 4 starting hexes doing a little worse when accounting for pips, but really, It has to be a fringe and extreme setup to start with only 4 hexes. Overall the takeaway is the same. The total pips matter, not the number of hexes it takes to get there.
Limitations
In addition to the limitations above, the big limitation here is I am treating all resources as equal. We all know (and I have established in a previous post) that the different resources have different values. For instance, 2 sheep are roughly worth 1 brick. I am not currently taking that into account, but may try to do so in an updated simulation in the future. Similarly, I am not taking into account other features like ports, expansion opportunities (does one spot give you better chances to build to your next settlement), and other factors that may go into your initial settlement decision. We may try to better understand those in a future post.
Conclusions
Overall, the takeaways are pretty clear. First, I think Doubling up on a number is worth it, so long as you don't go crazy and sacrifice 2+ pips to get it. Second, Don't worry about 5 or 6 hexes, instead focus on the total pips the options would produce. While the analysis here doesn't account for what the resources are, hopefully, it can help us all choose better starting settlements.
Questions? Comments? Let me know at ac@alexcates.com. Want to read more breakdowns like this? sign up for my newsletter. Finally, like what I do? Consider supporting me on buy me a coffee.


